Summary Report
Summary Report, as the name indicates, is a report type that enables you to view your summarized data in table formats. This report type is extremely useful when you need to analyze huge amount of data with logical grouping and appropriate summarizations in a visually intuitive manner. You can also filter, sort, apply conditional formatting and do much more.
Creating A Summary Report
Follow these steps to create a Summary report:
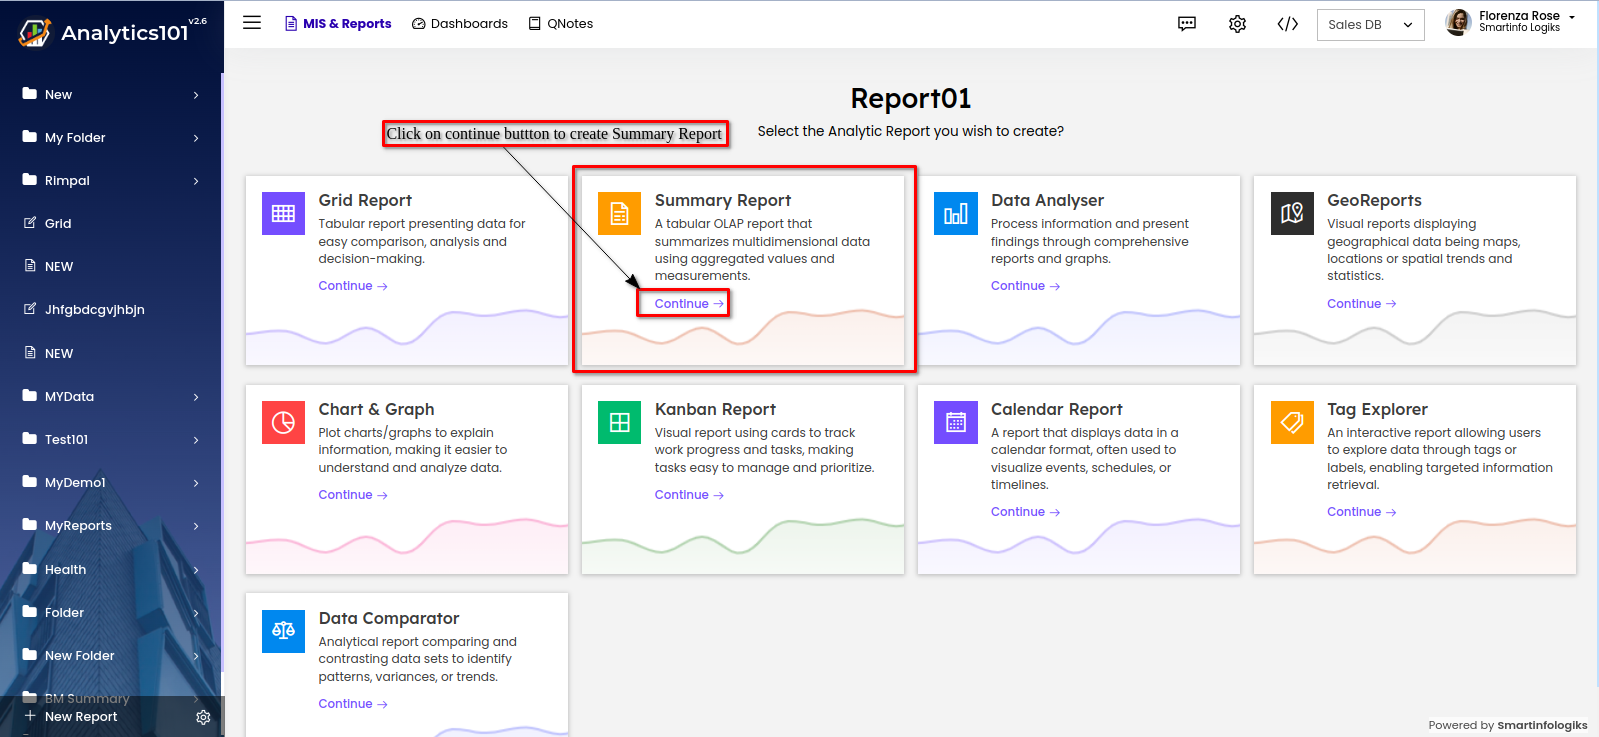
- Click on the "Continue" button to create a Summary Report.
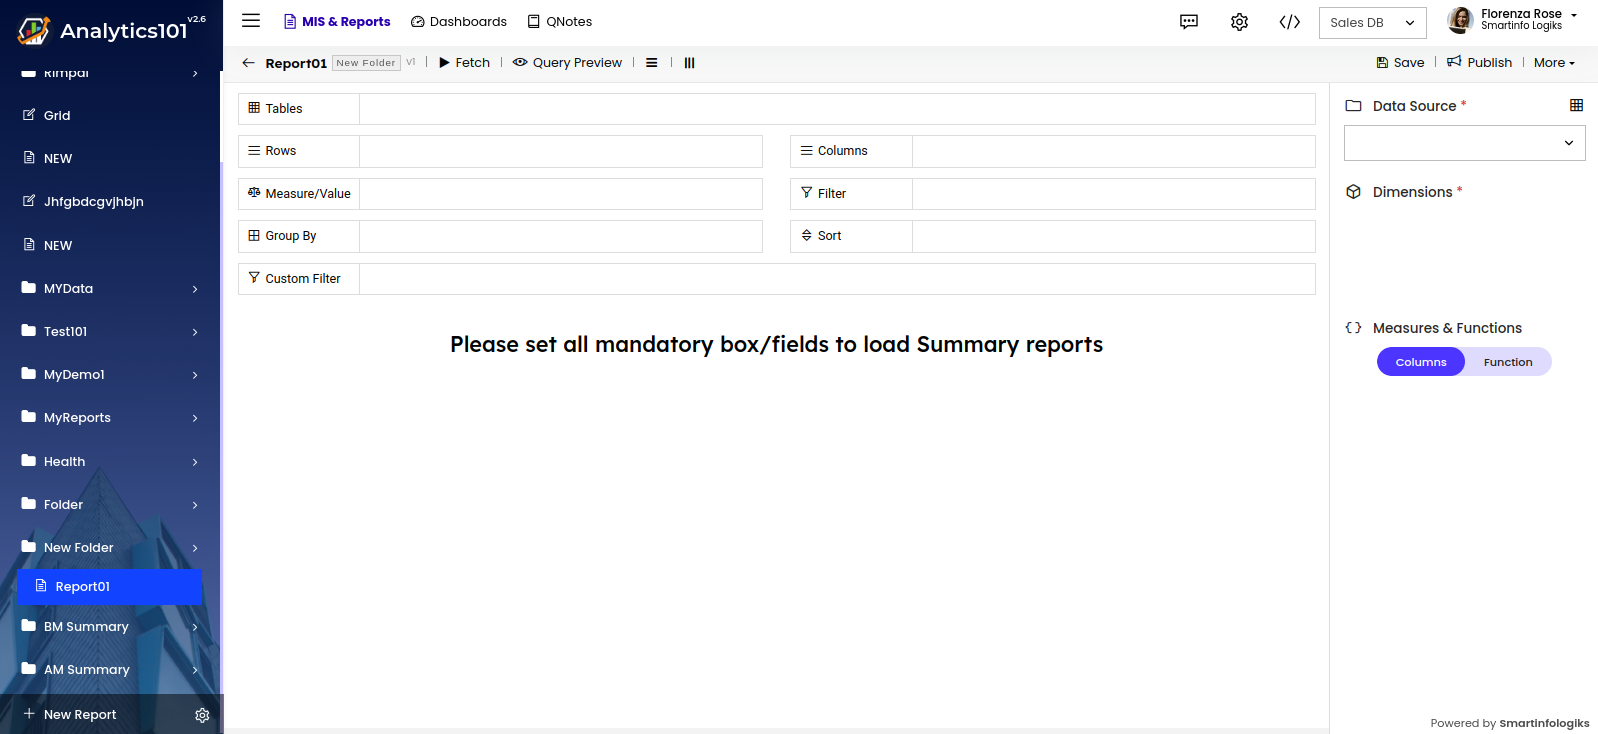
- A window will appear for creating a new Summary Report, like this :
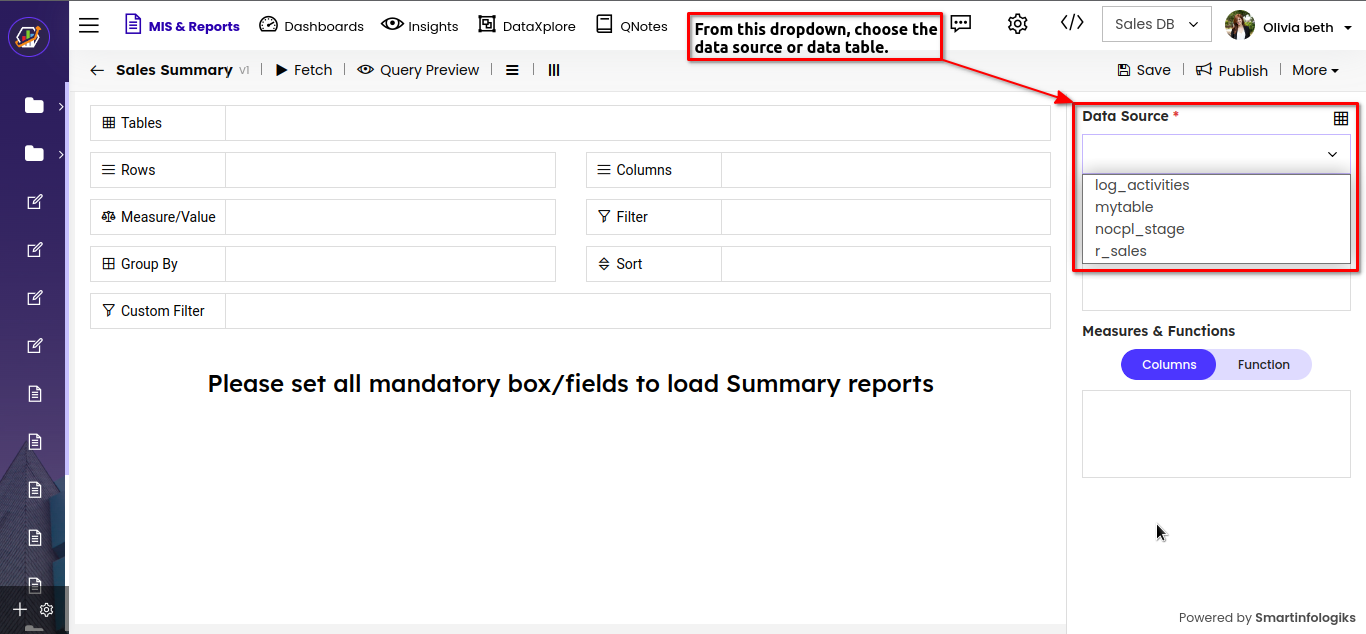
- Select the table form "Data Source" drop down.
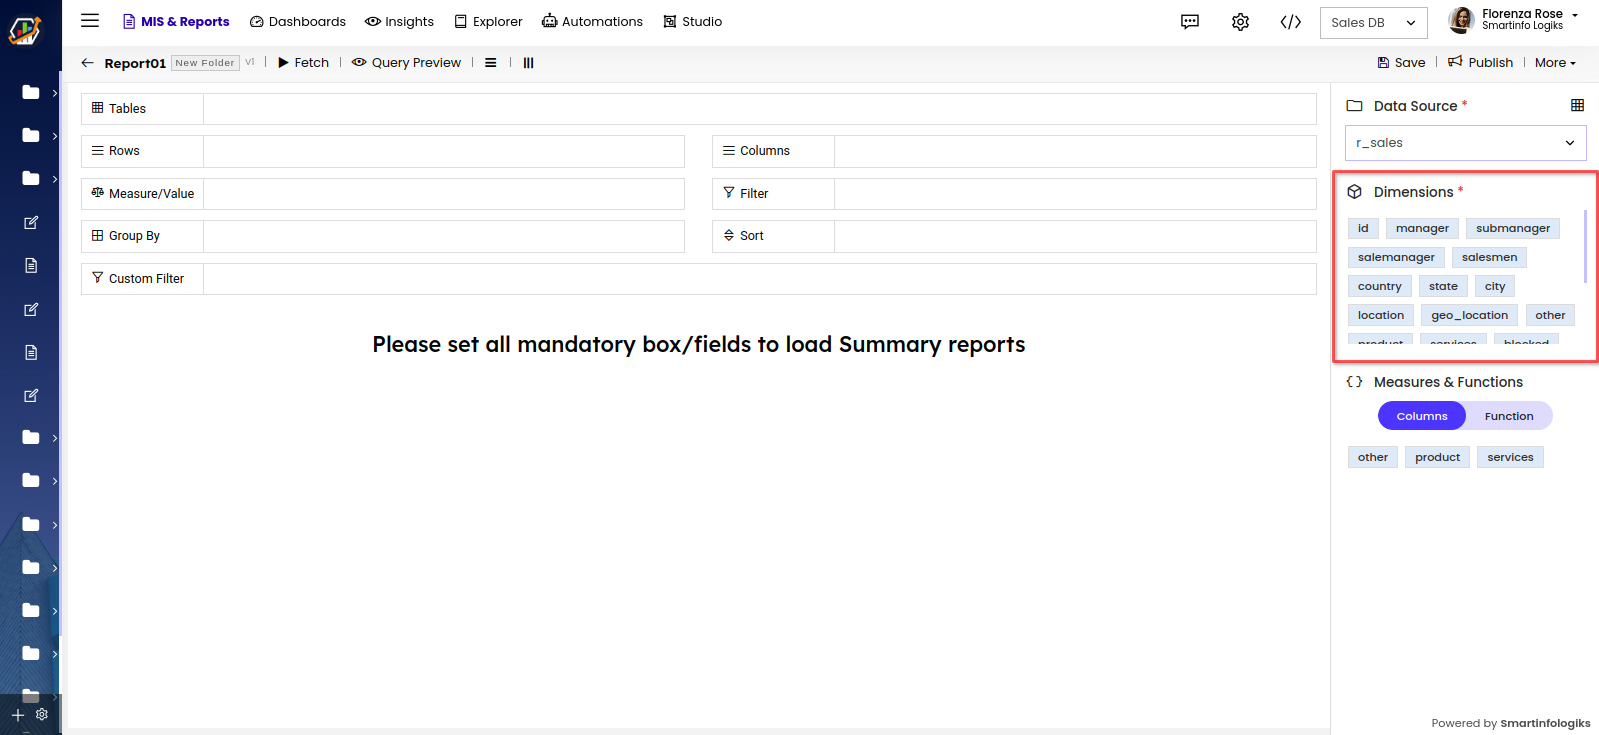
- Columns will appear in the "Dimensions" section as shown below :
- The Functions section contains two parts:
Columns: contains all the numerical fields of the table.
Functions: contains all the formulas both existing ones in the system as well as user customized formula, enabling users to tailor reports according to their preferences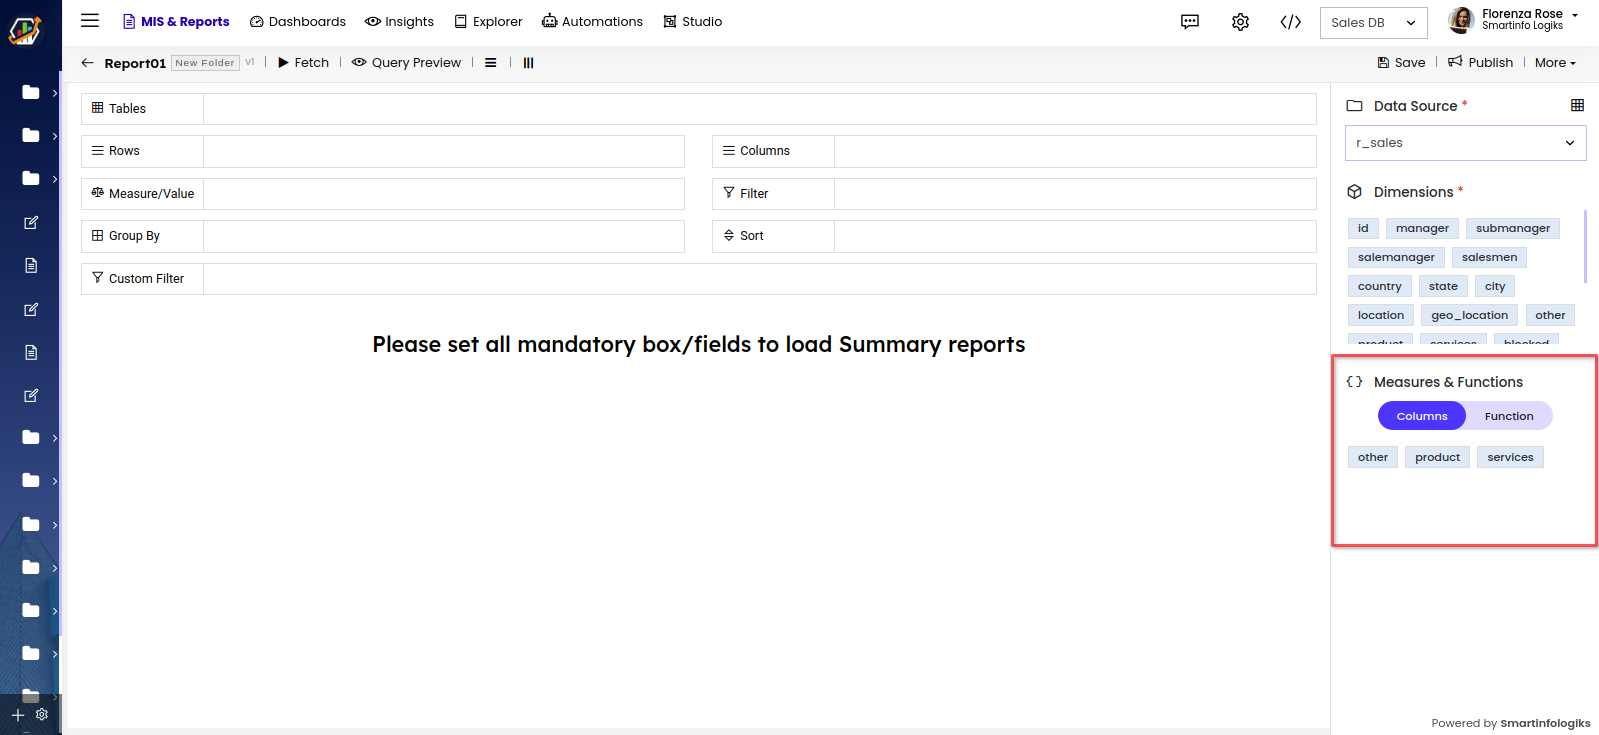
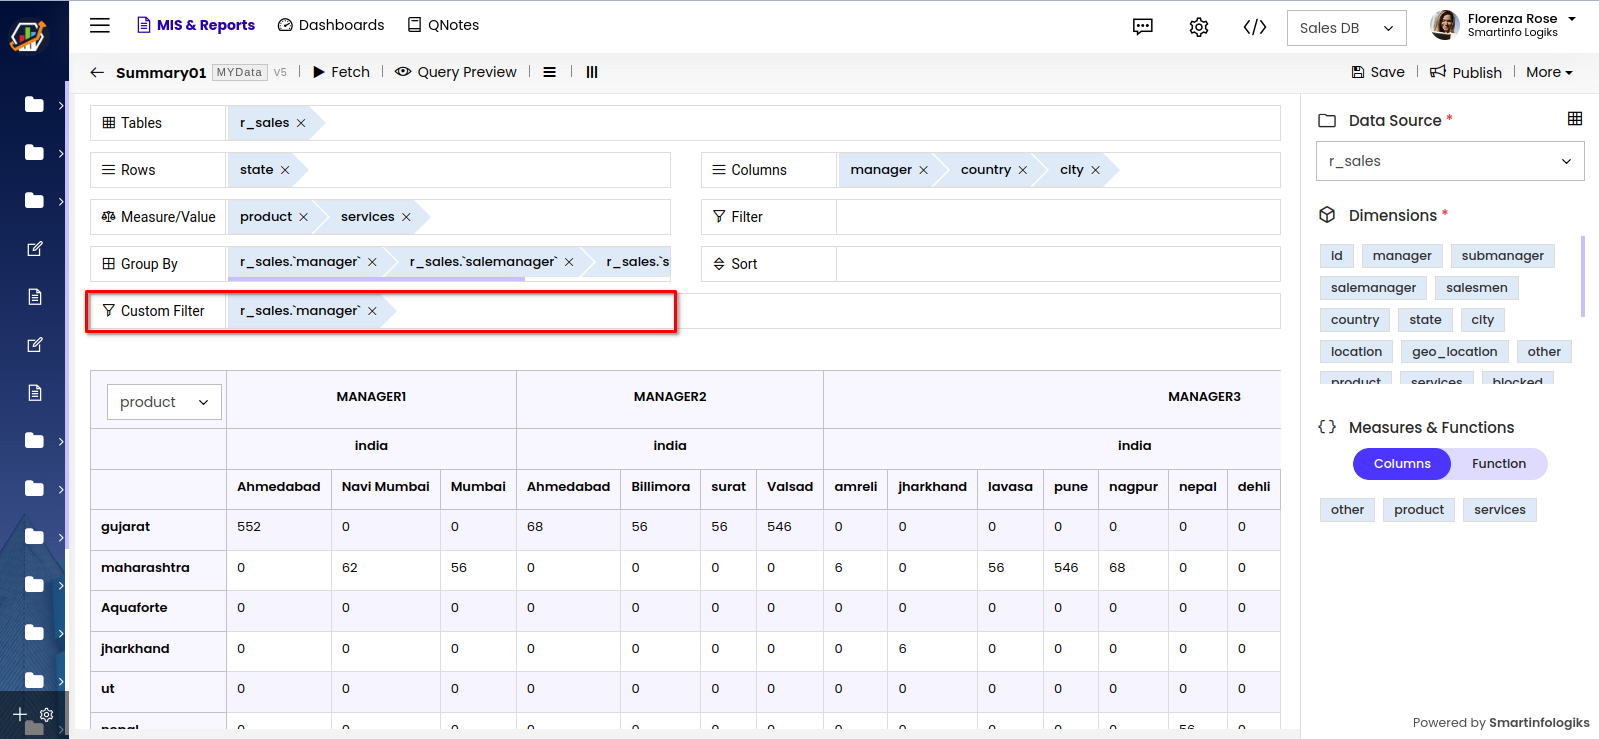
- Drag and drop the columns onto their respective shelves.
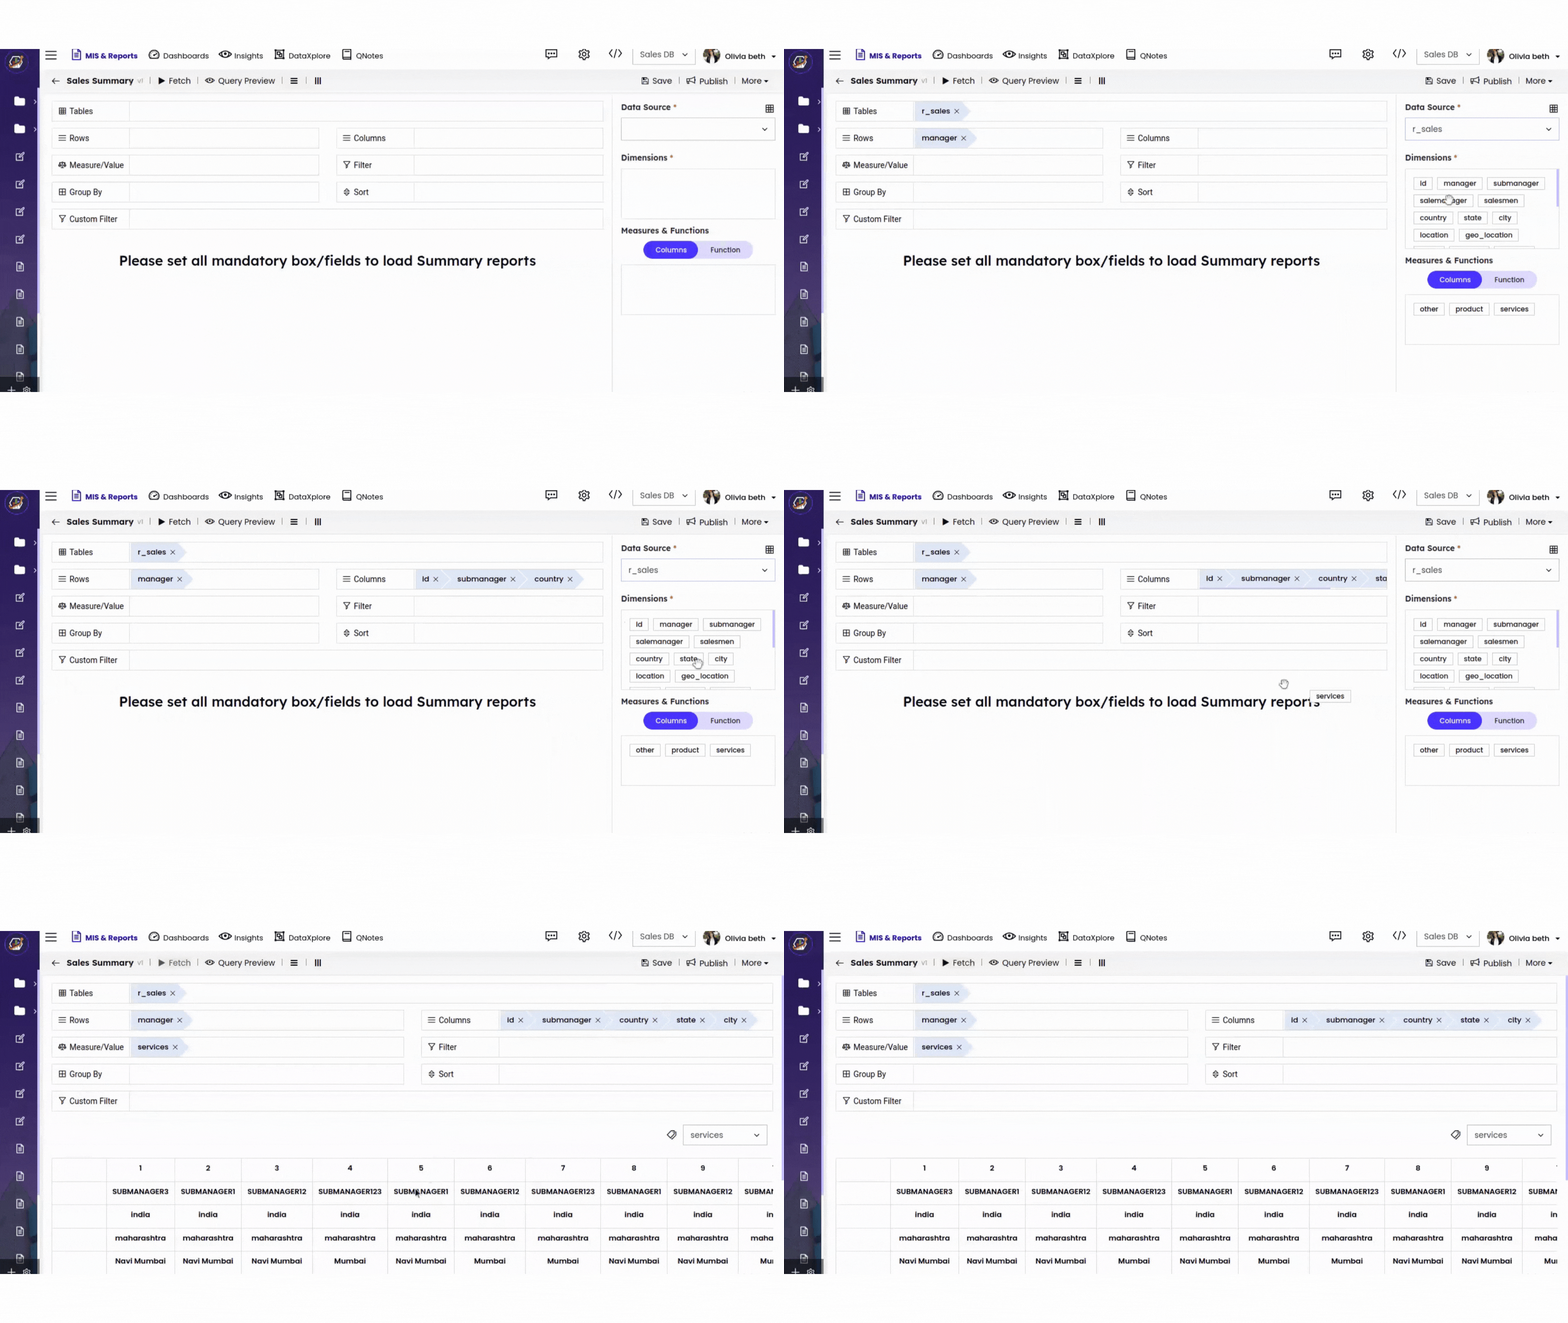
- Click the Fetch button to Generate Summary Report, the generated report will appear on the screen.
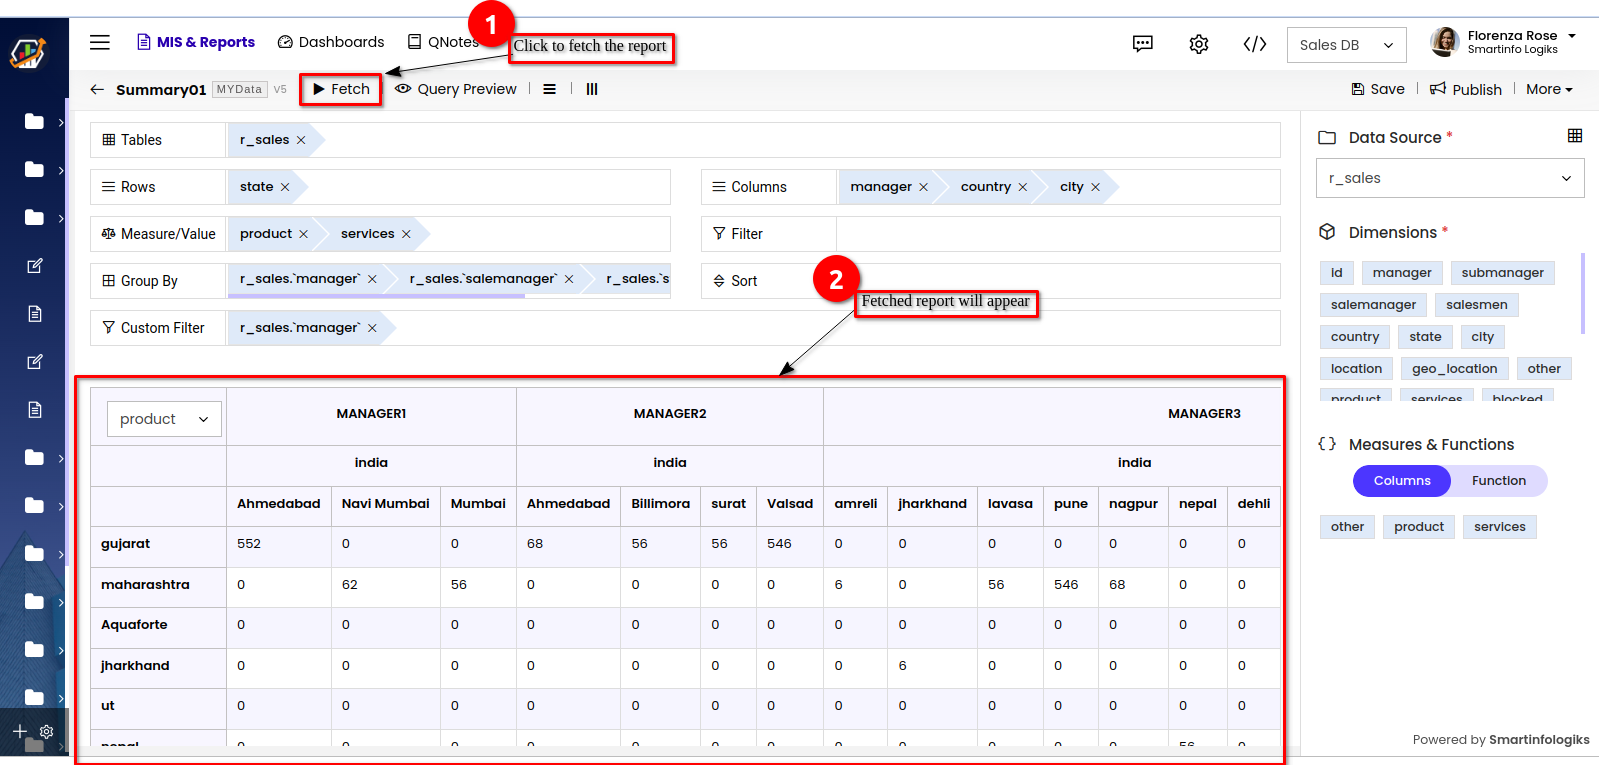
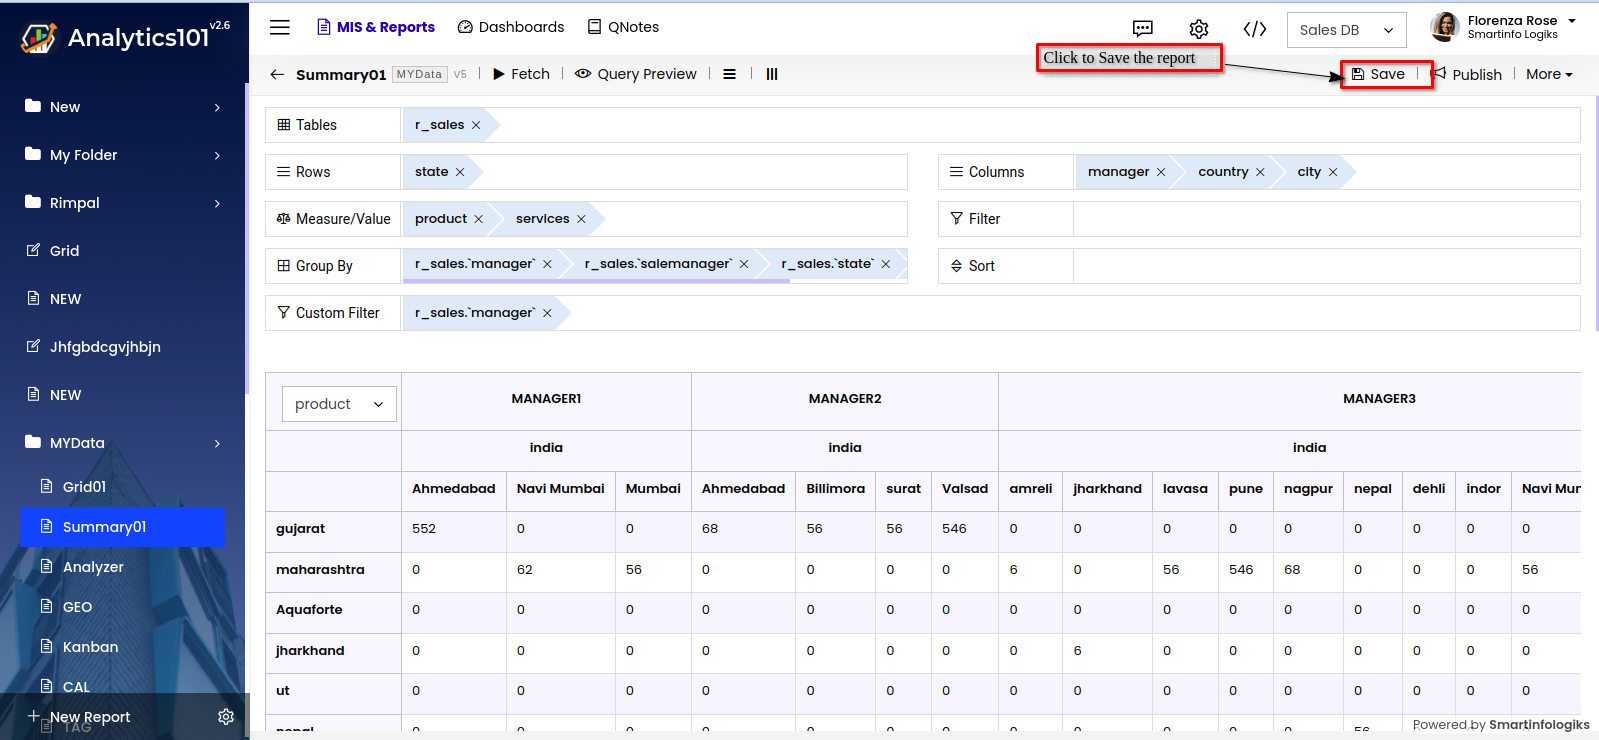
- Click the "Save" button to save the Summary report.
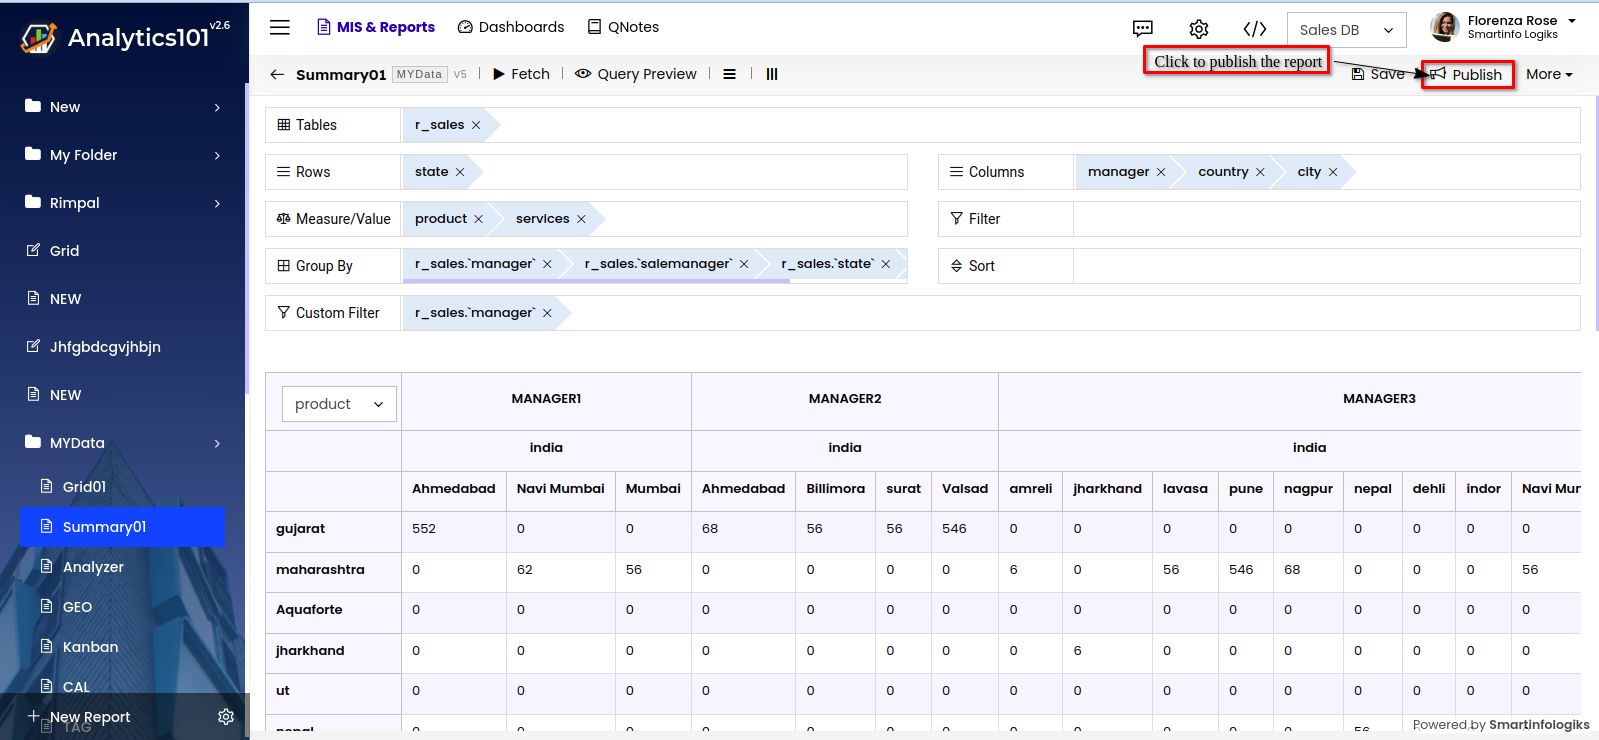
- Click the "Publish" button to publish the Summary report.
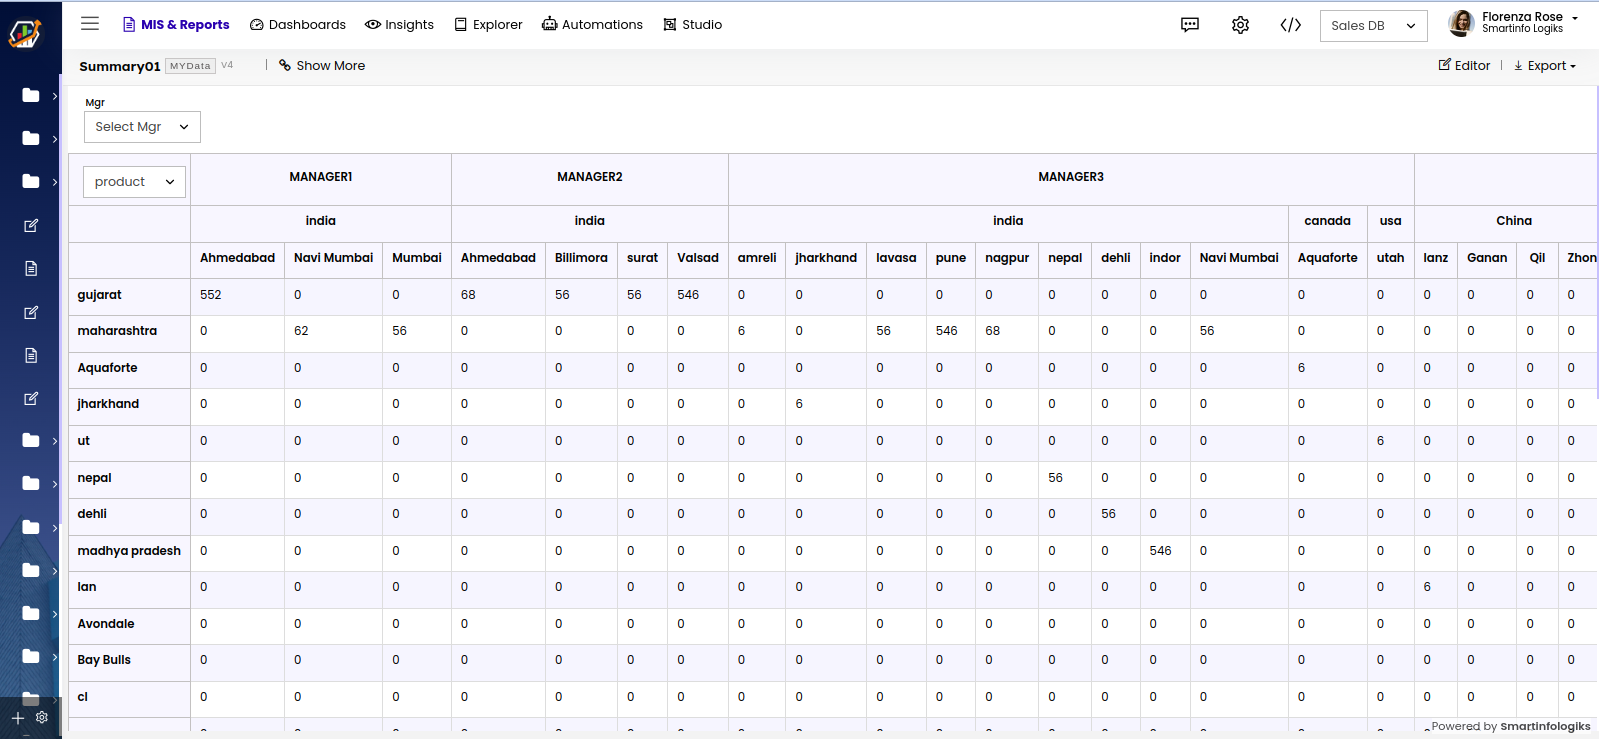
- After publishing the Summary Report, it will be visible on the screen shown below:
More in Summary Report Editor
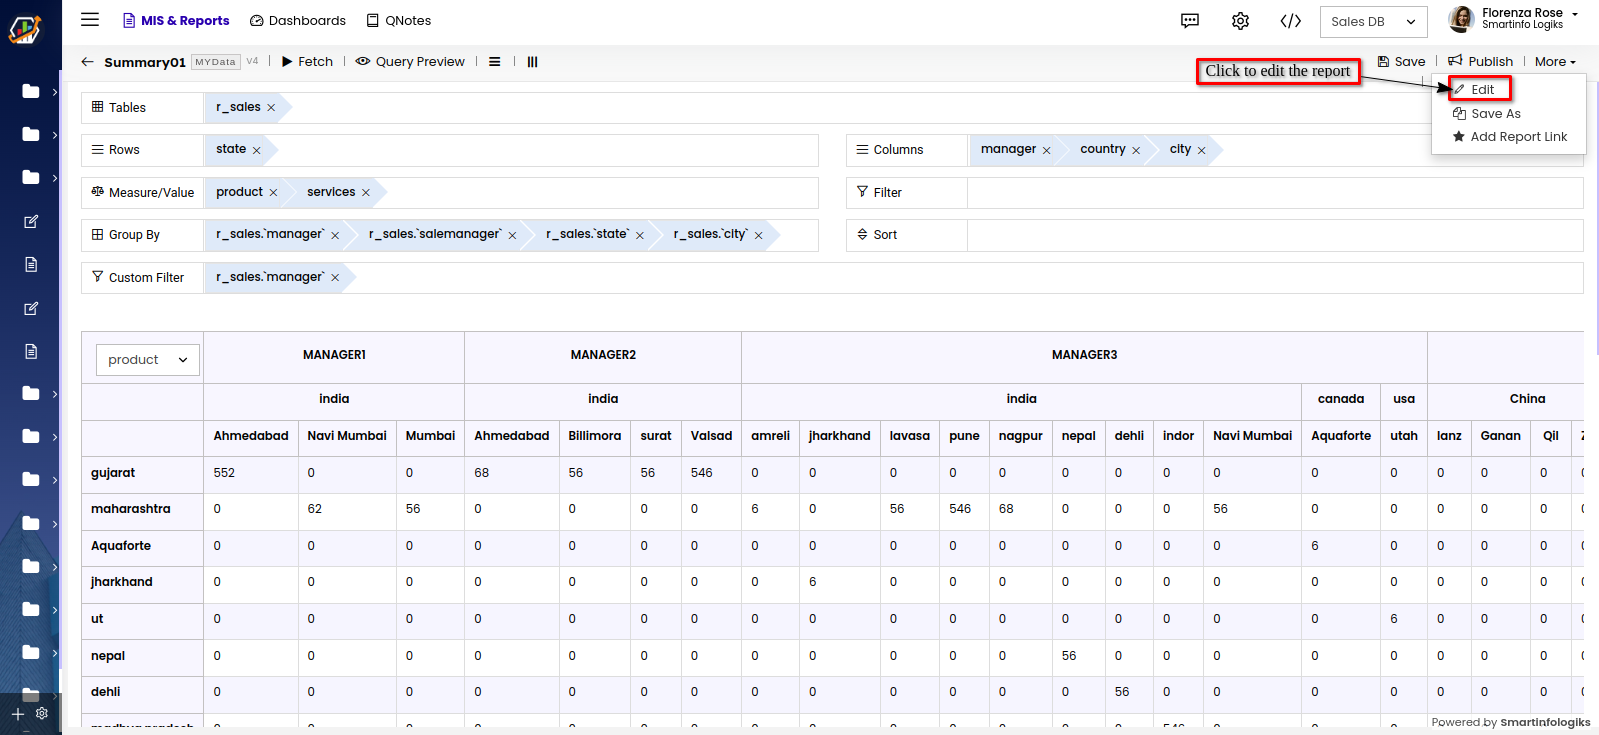
To manage the report click on the More , different options for managing the report will be displayed.
Edit:
- Click the Edit to edit the report.
- A Pop up window for editing the report will appear.
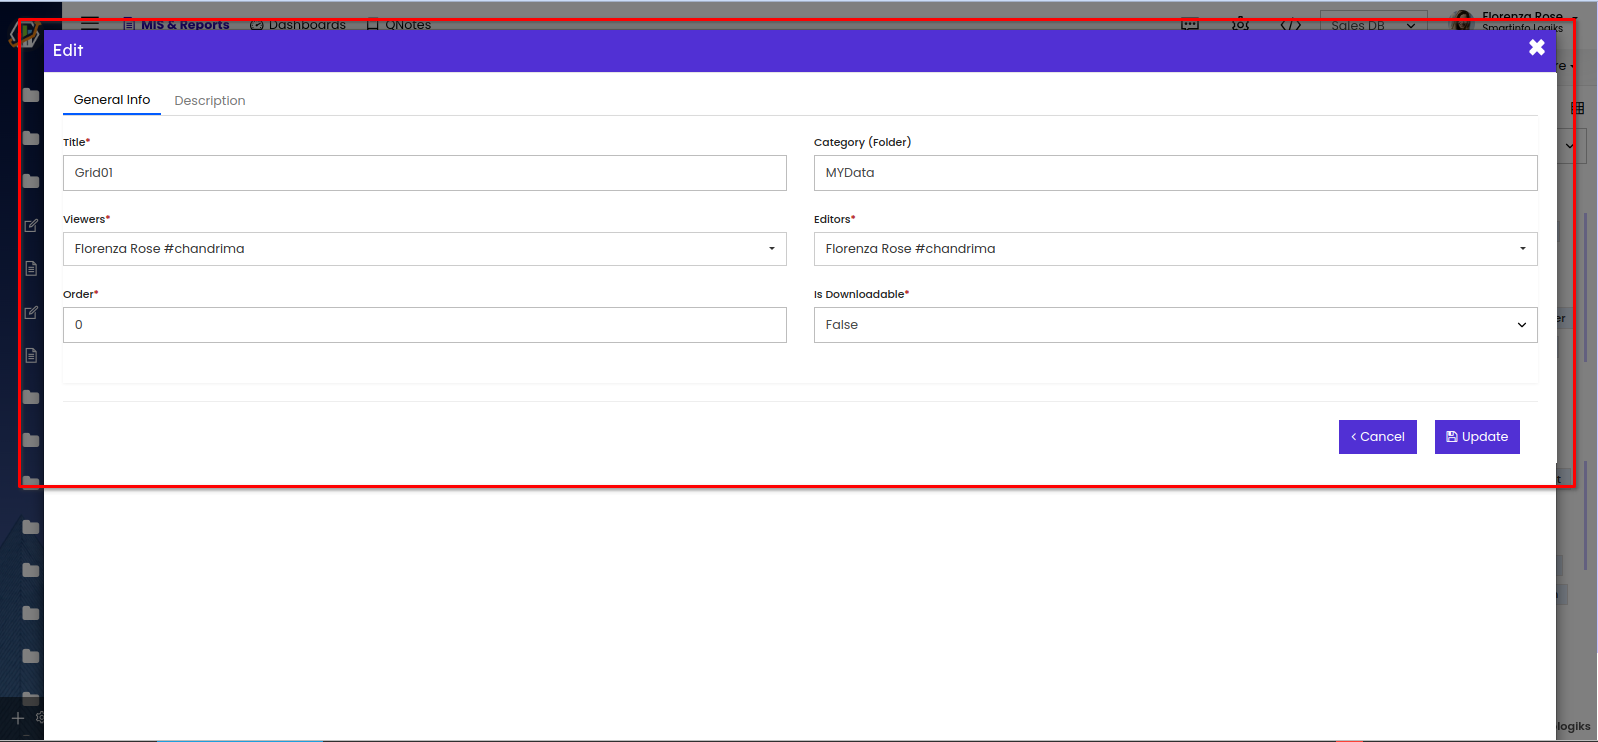
Title- User can edit the title of the Report.
Category- To edit the folder of the report.
Viewers- Gives viewing access to the users selected.
Editors- Gives editing access to the selected users.
Order- User can assign the position of a report like 1st, 5th, etc.
Is Downloadable- enables users to download the published report.
- Click the Edit to edit the report.
Save As:
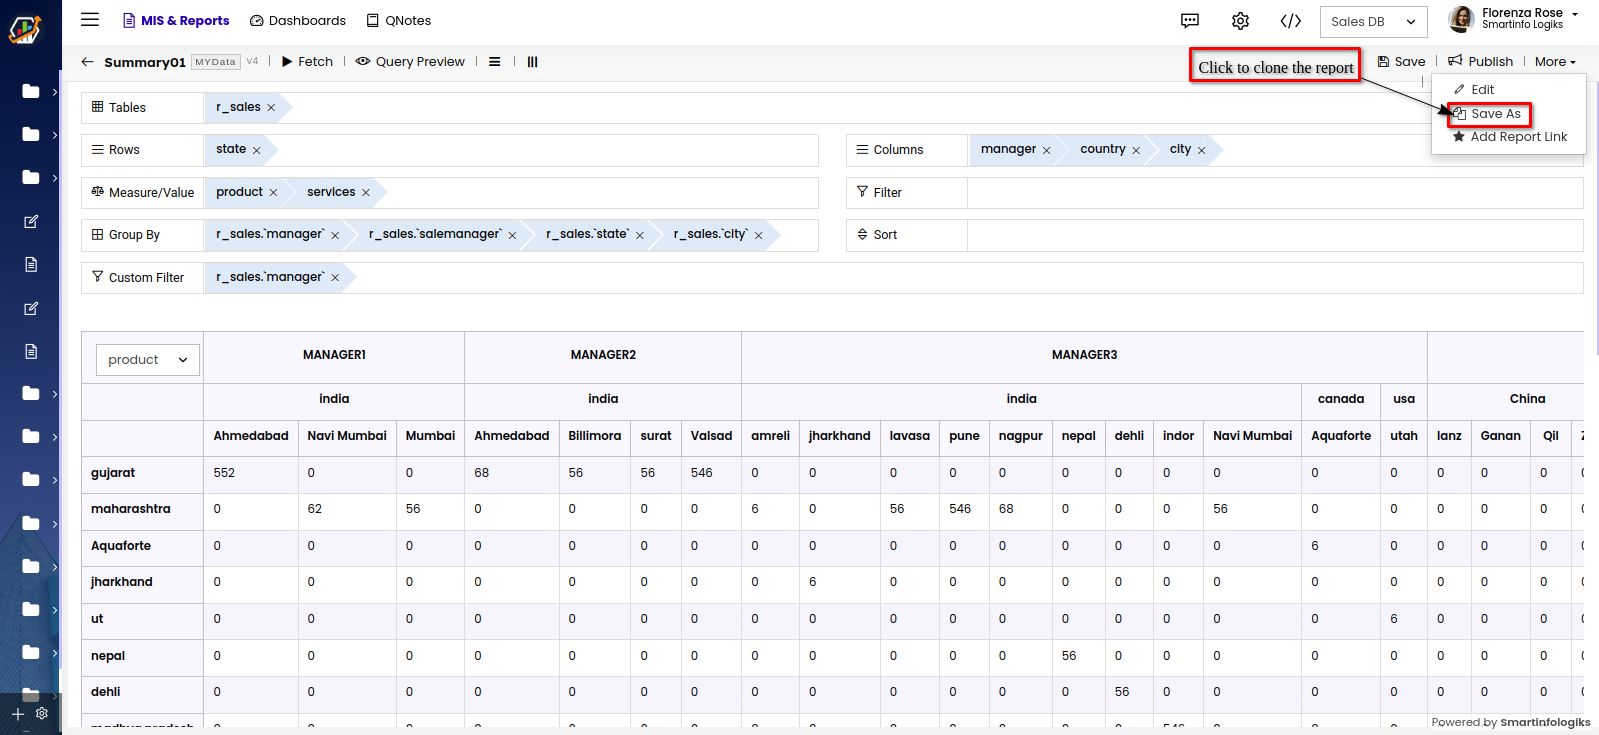
- Click the 'Save As' to clone the report.
- A Confirmation window will be displayed.
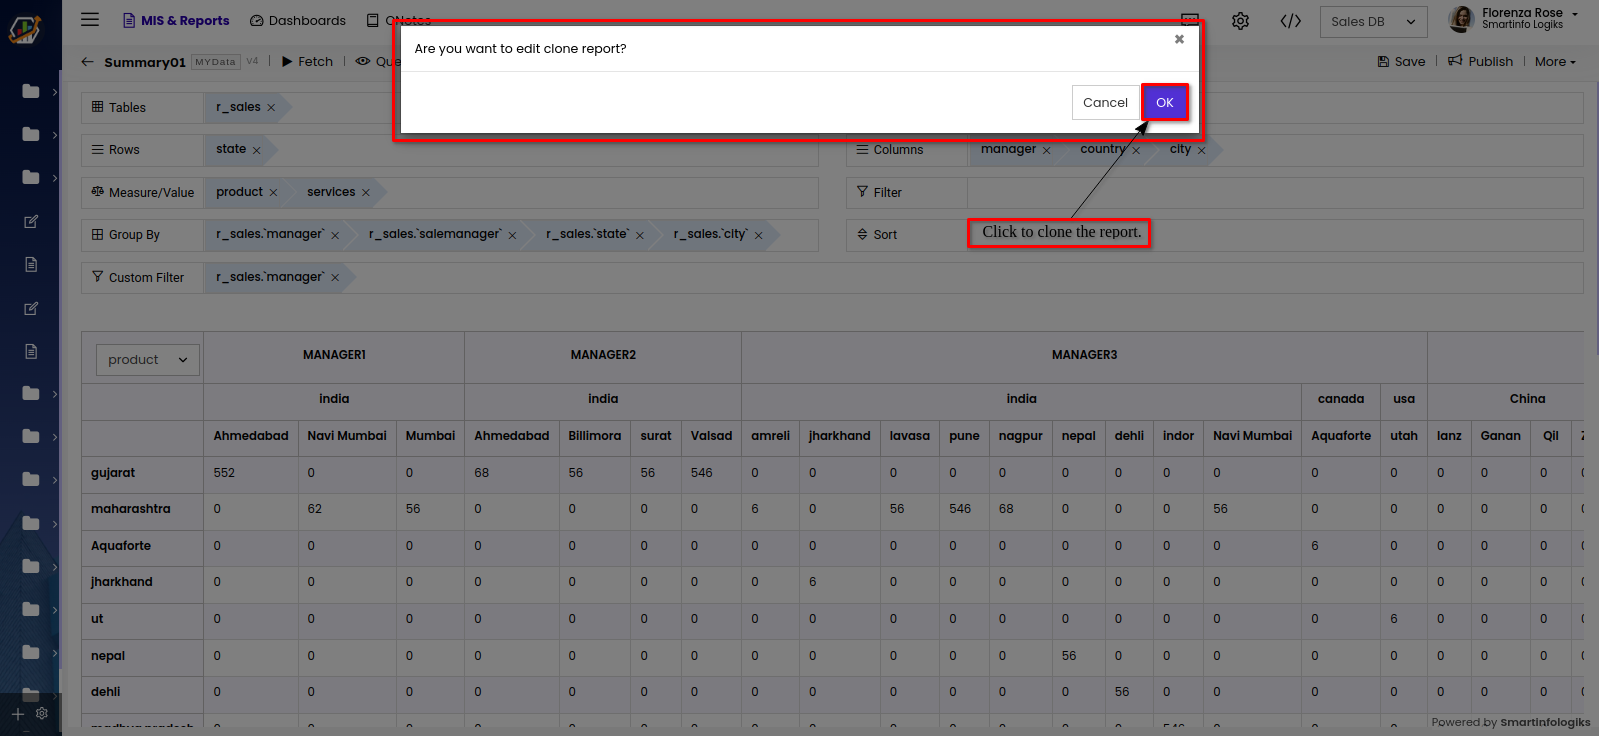
- On clicking the 'OK' button, the report will be cloned.
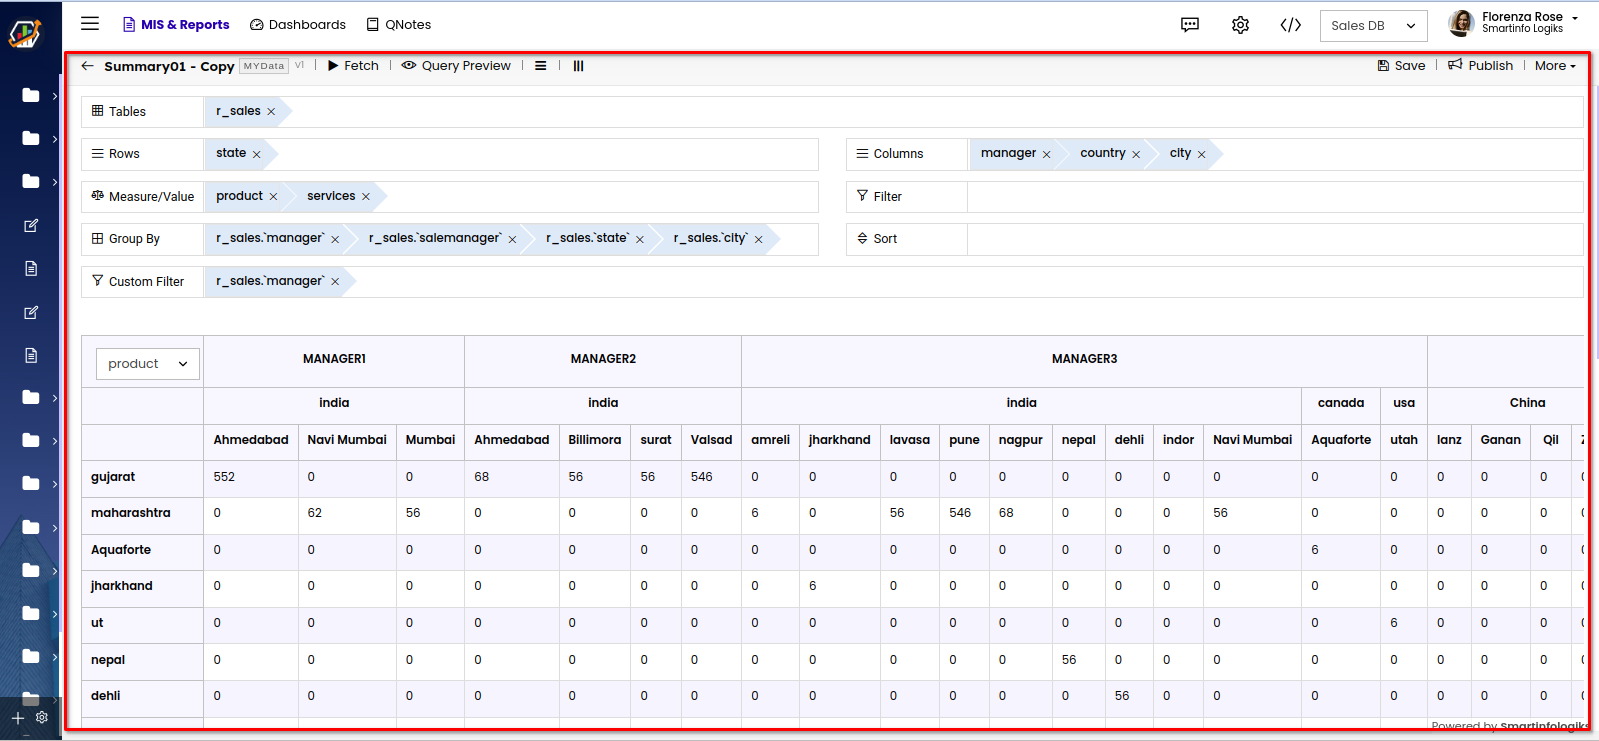
- Click the 'Save As' to clone the report.
Add Report Link
- Click the "Add Report Link" located under the More to link another report to this Summary report.
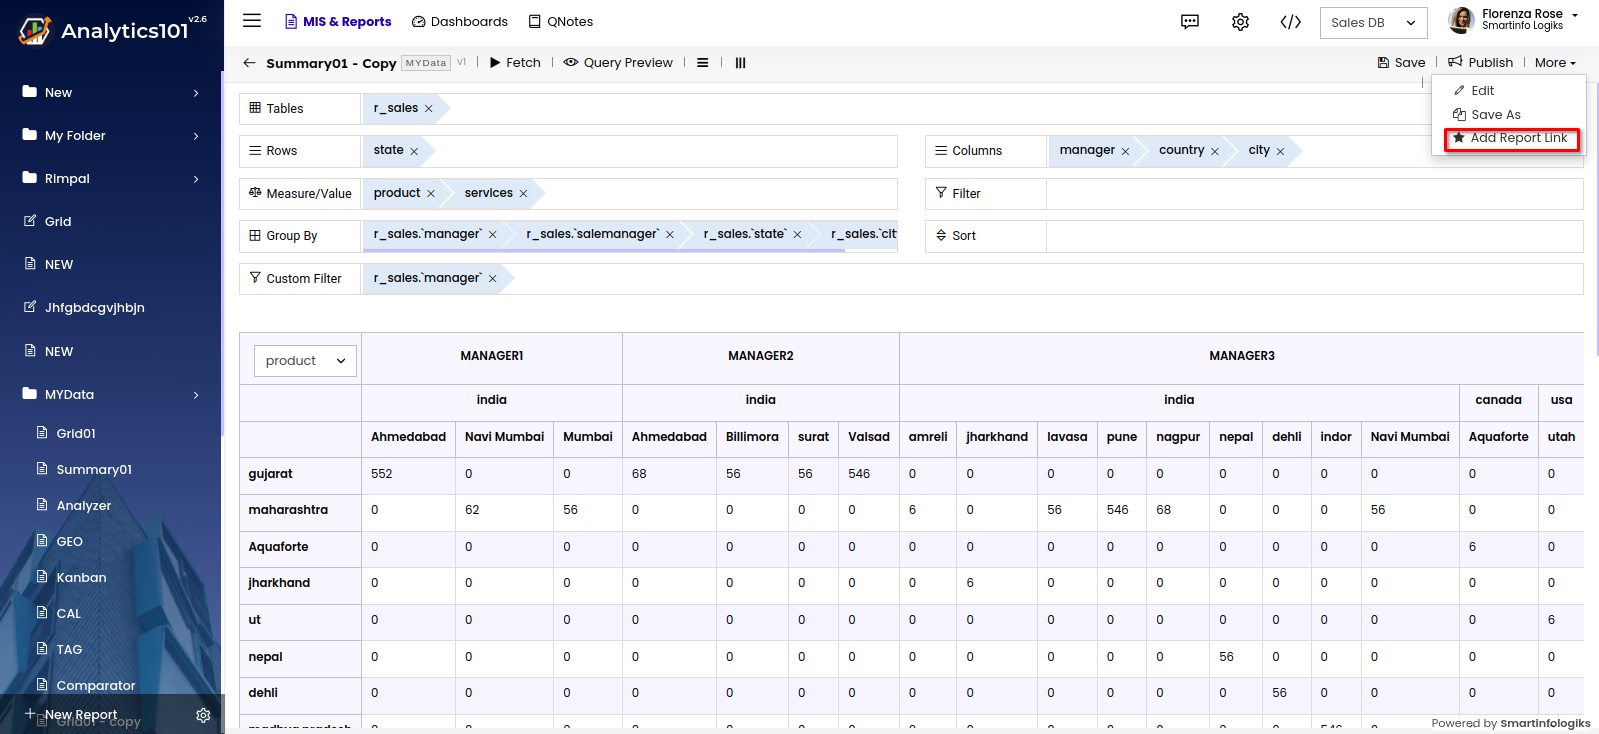
- The add link form opens shown below after clicking the Add Report link.
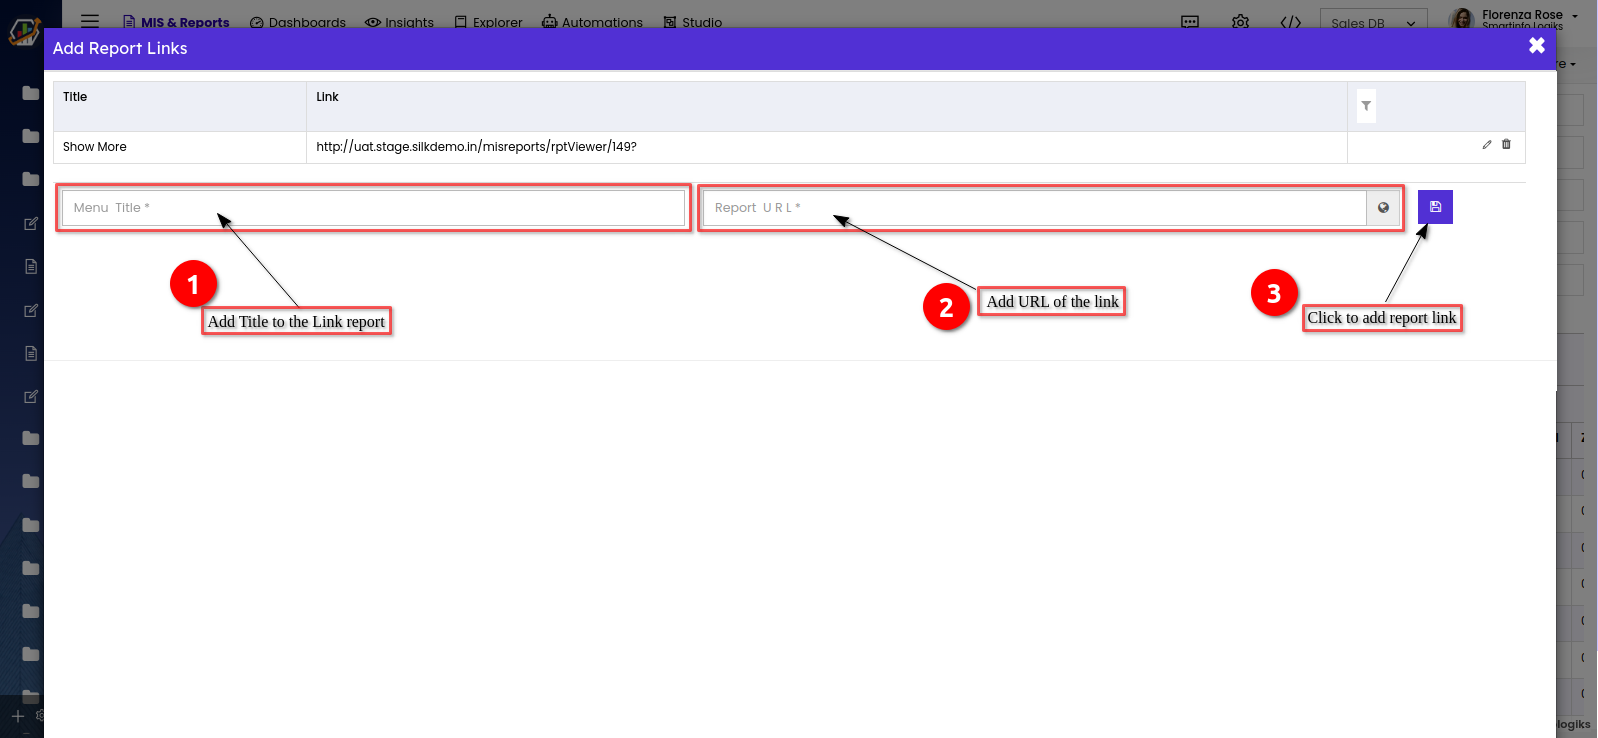
Title - Enter the Title you would want to view on the report link.
Link - Enter the URL of the report, you wish to link to or show with another report - As shown below, when the report is linked, it appears in a specific link added report.
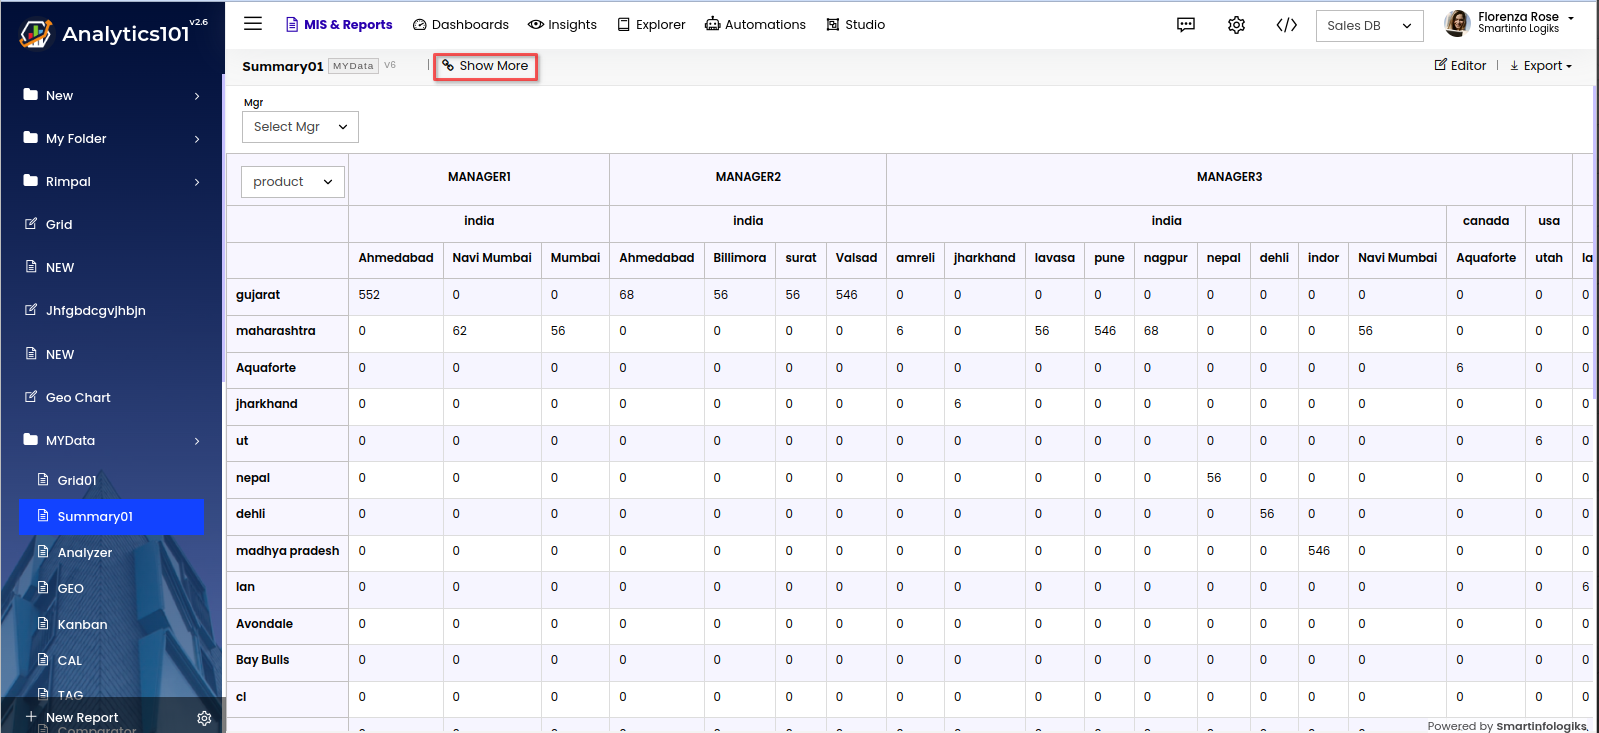
- Click the "Add Report Link" located under the More to link another report to this Summary report.
About Shelves
The following is a brief description of shelf in the Design Area of the Summary Report.
Tables : Table shelf automatically shows the active table that we are using to create report once a column is dragged into the editor.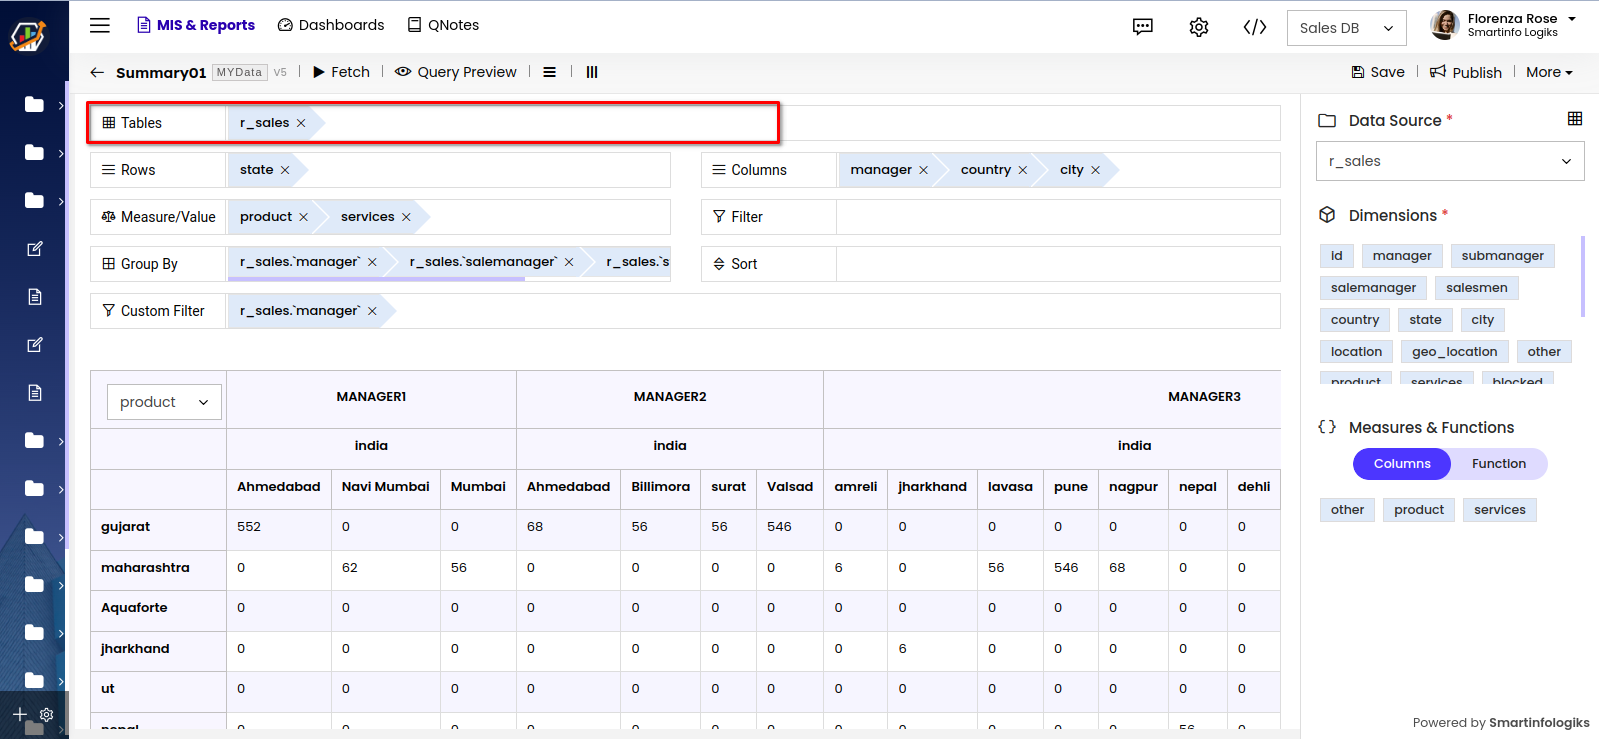
Rows: Organises the records of fields selected horizontally.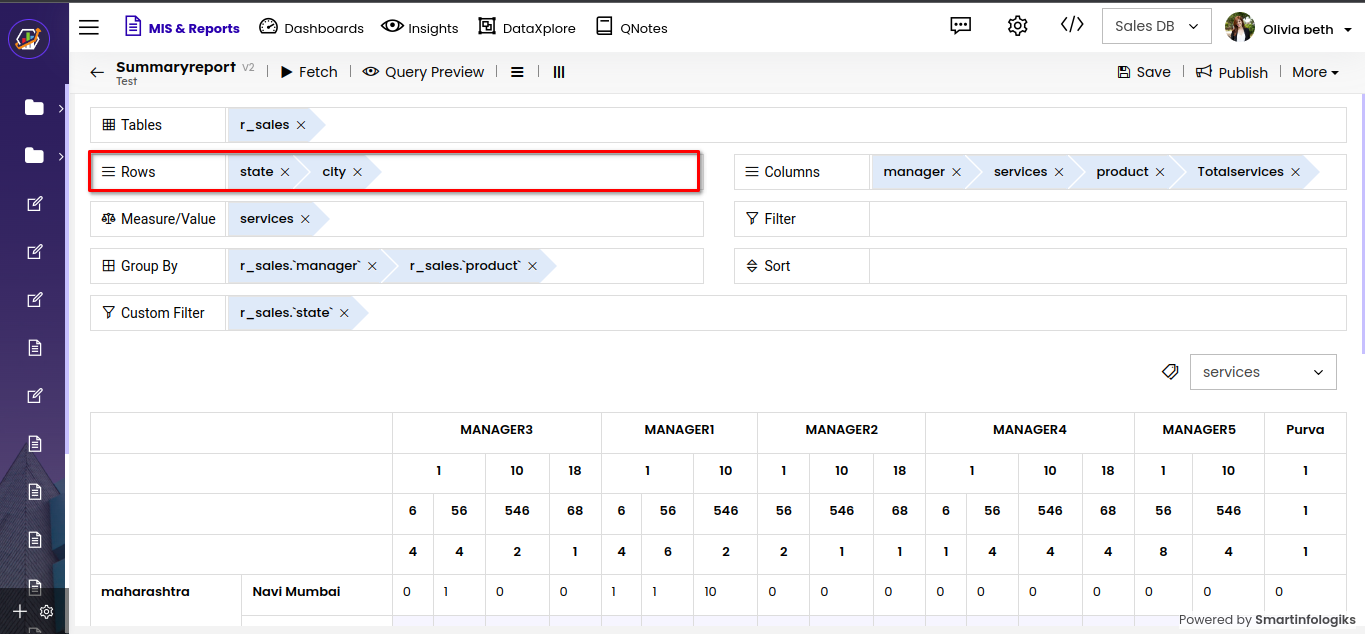
Columns: In this shelf columns of the table is dragged and dropped from the dimensions section. You can drop any number of columns in this shelf.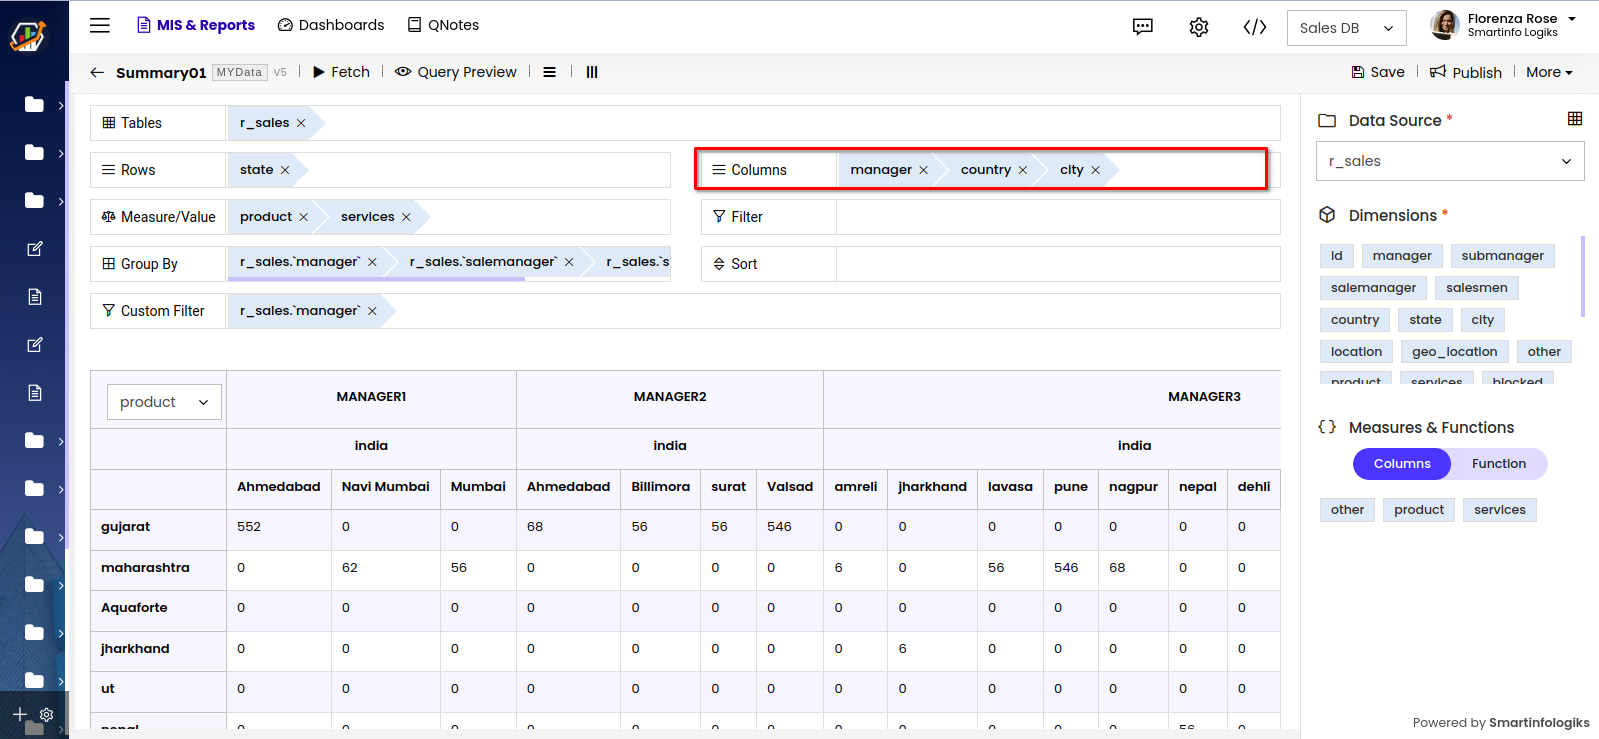
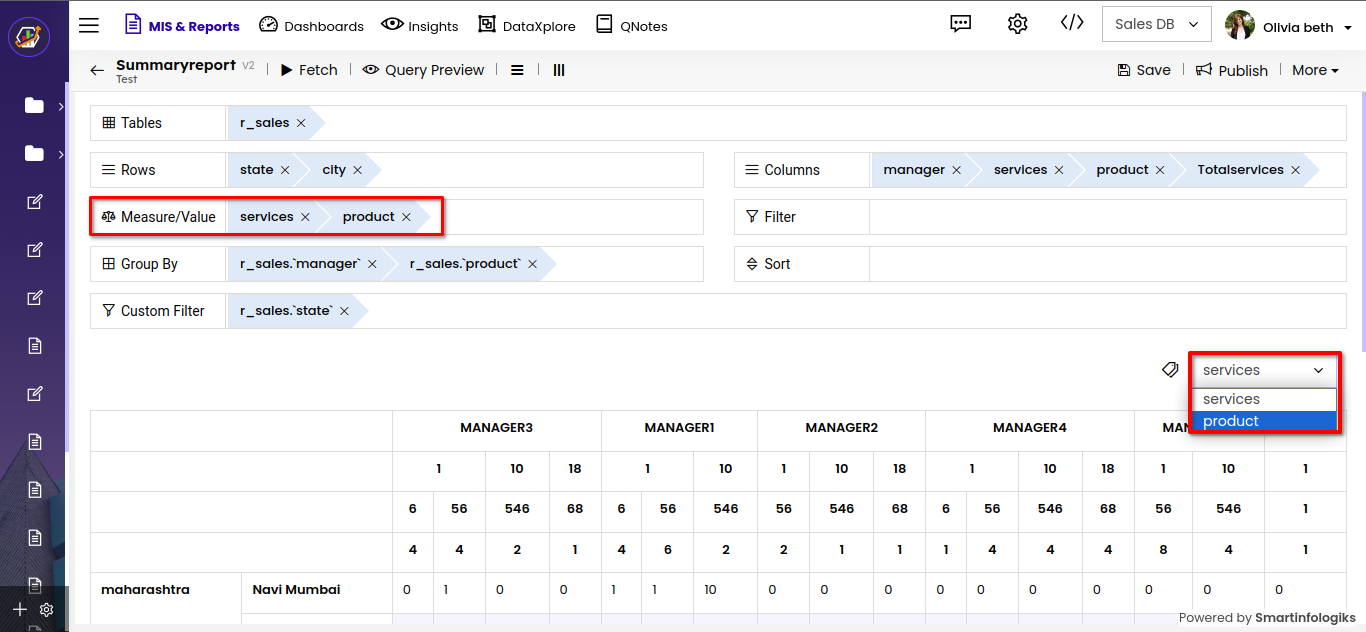
Measure/Value:Measures takes only numerical fields from the table which is reflected in the center of this olap report.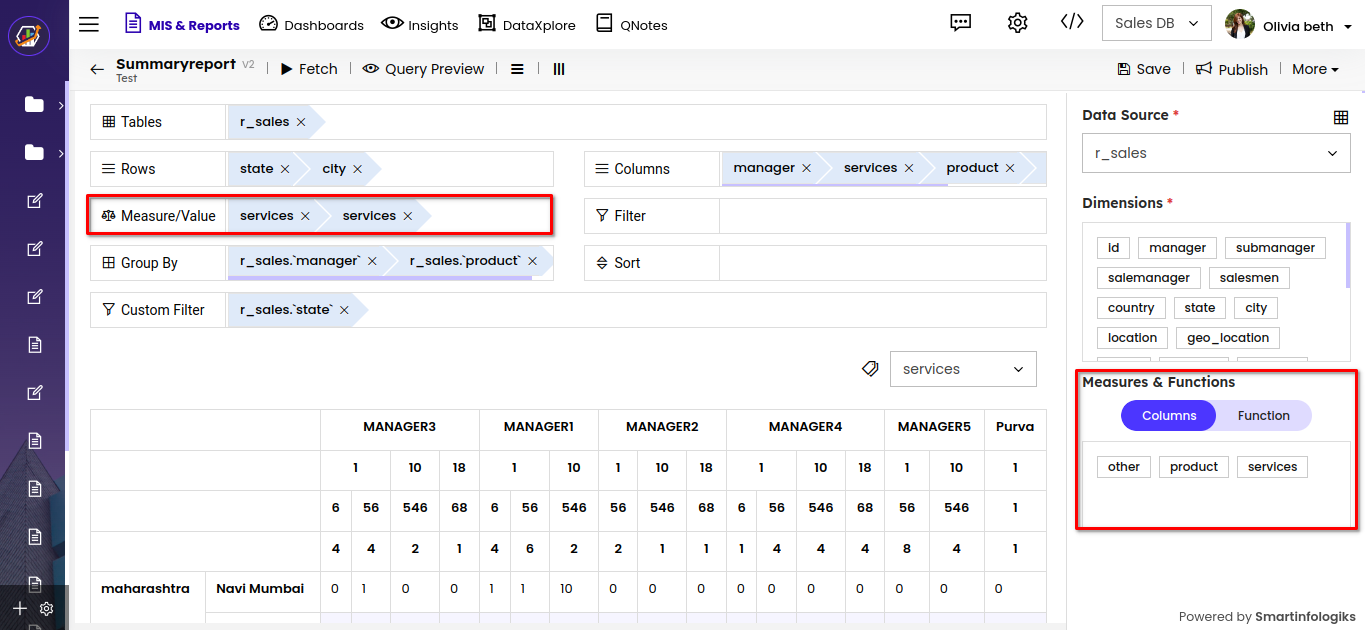
Filter: Filters let users quickly narrow down data to specific criteria, enabling them to tailor reports for their needs.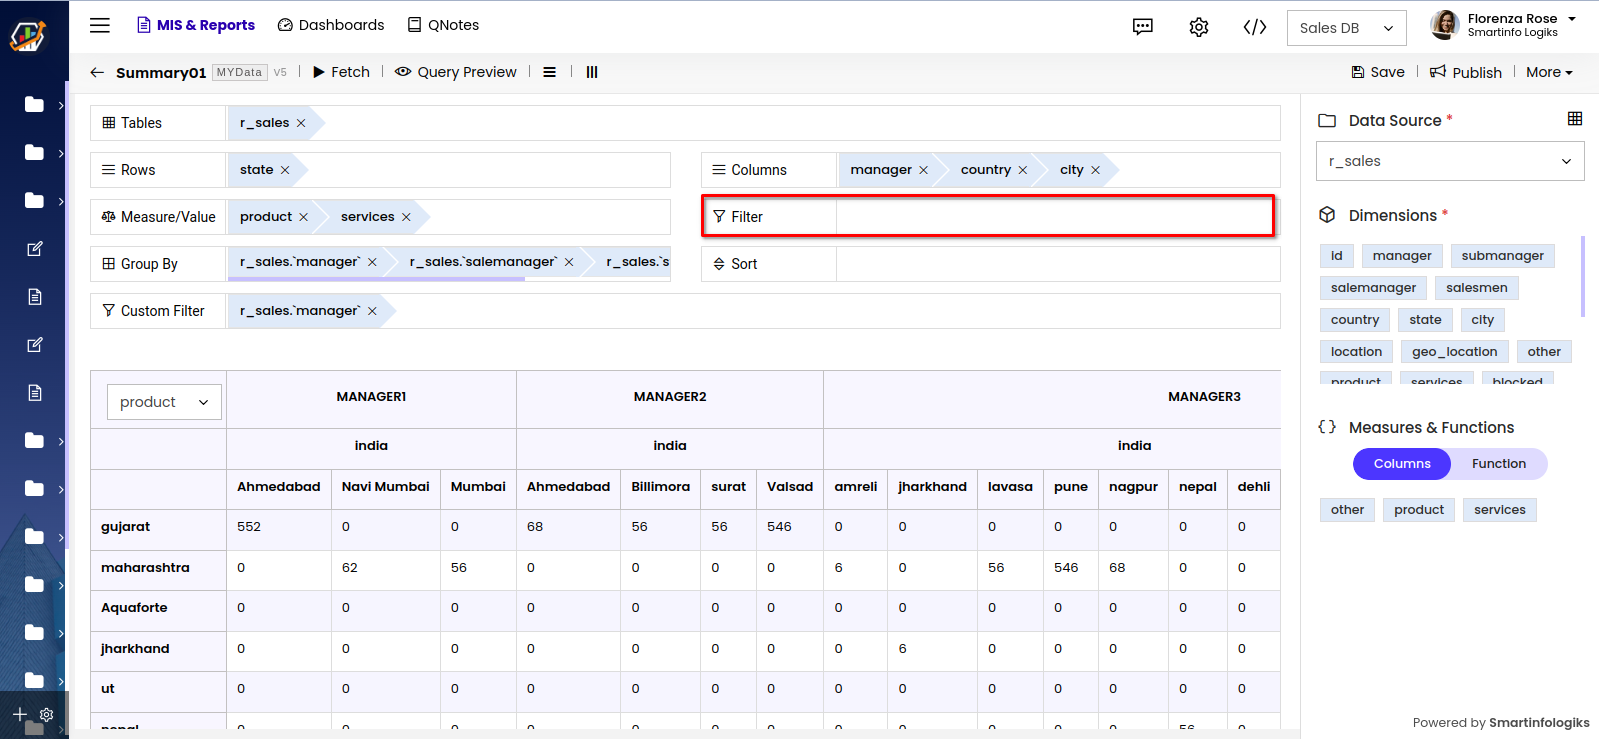
Group By: This shelf allows the users to aggregate and organize data based on specified criteria.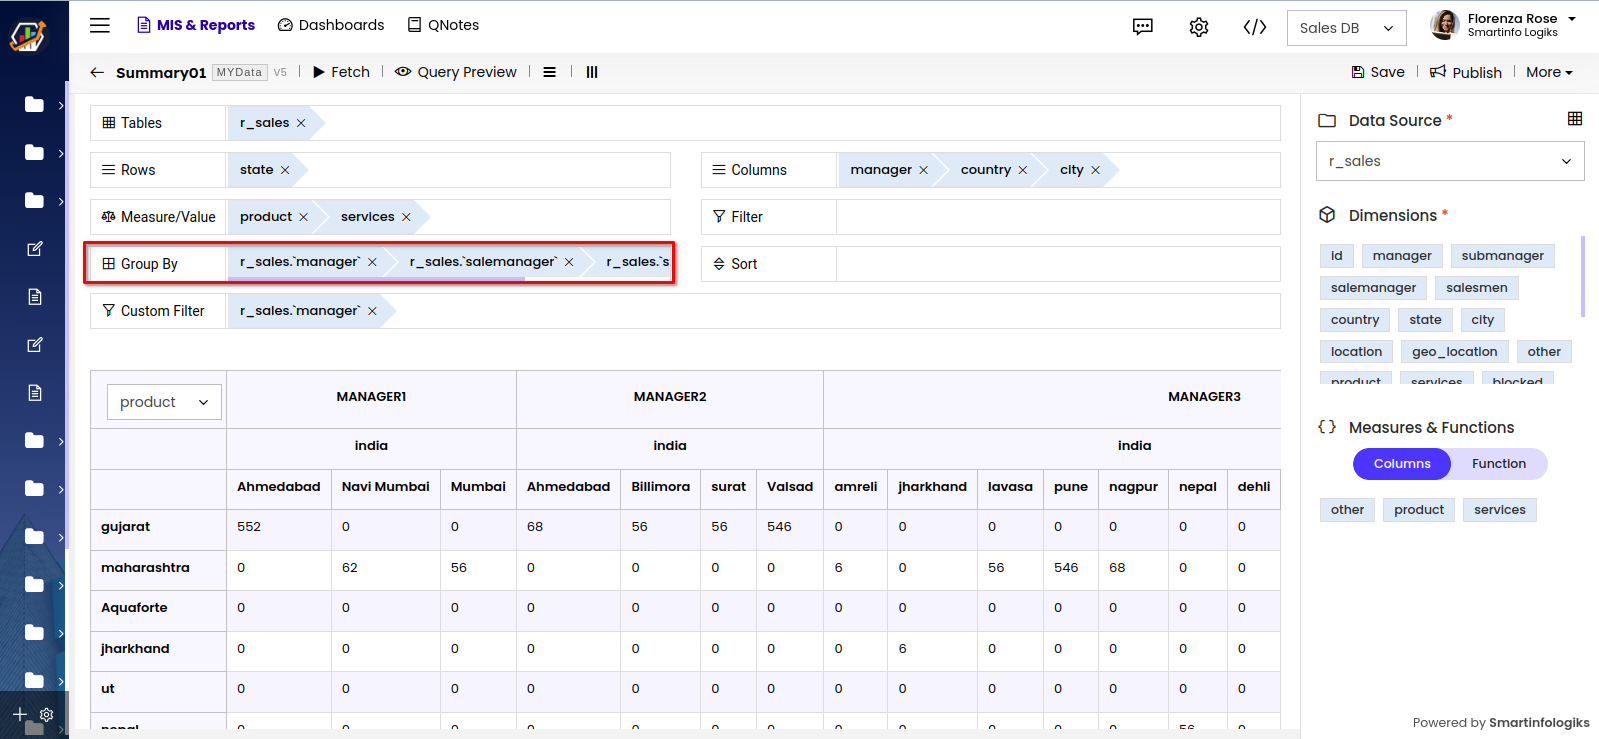
Sort: Users can organize data rows according to defined criteria, arranging them either in ascending or descending order.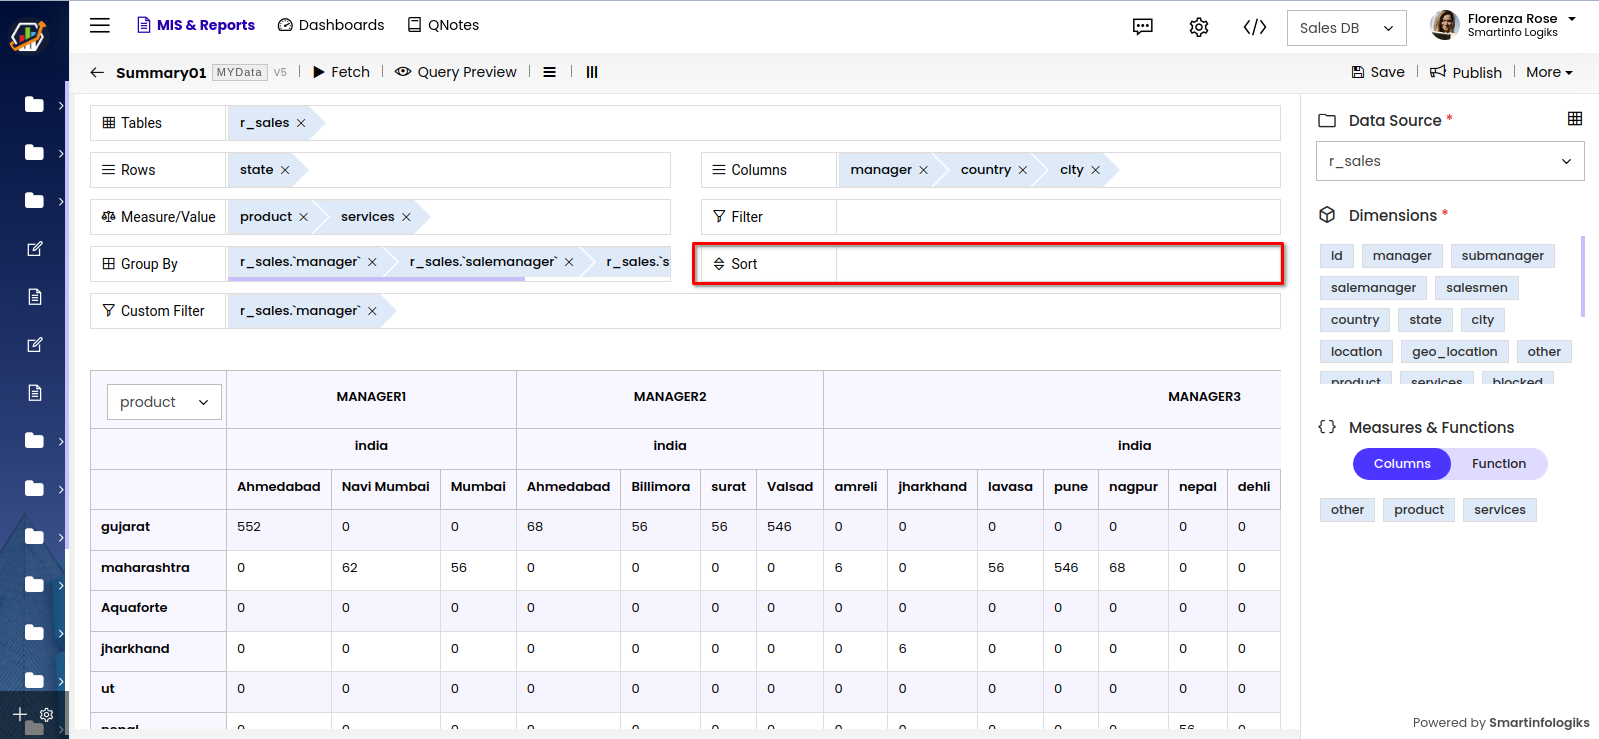
Custom Filter: Lets users create their own user filters like dropdowns, text inputs, and more. This helps refine published reports based on specific data choices.